

Most of the marketers I’ve worked with create customer avatars that look something like this:

- Buyer Segment: Quick Decision Makers
- Name: Noah Ogle
- Title: Director of Development
- Location: Counsel Bluffs, Iowa
- Income: $120,000 per year
- Education: College Graduate
- Children: 2
- Marriage Status: Married for 12 years
- Computer: Latest Apple Computer & Phone
- Background: Software Developer & Manager
- Years In Industry: 14
- Previous Roles: Developer, Development Manager, Director of QA, Director of Development,
- Coffee: Black with a pinch of sugar
- Etc.
Look familiar?
Most of the time, these profiles go on to have a lot of great information that would help you identify this person in a crowd and know what to talk to them about to get their attention and probably to help them make a buying decision.
This is all great qualitative data, but what’s missing almost every time is the QUANTITATIVE DATA.
If you want to know what really matters, it’s in the numbers.
Here are some examples of what you can do with the quantitative data that you don’t get from the qualitative data:
- How much more money you’ll make by improving or adding features
- The specific value of each customer segment in dollars
- Which segment is making or losing you money and how much
- Which features or systems to improve and the financial impacts of these changes
- When to drop or improve support for certain groups of customers
- What actions drive revenue in the most meaningful ways
I’ve yet to see these kinds of decisions made from customer avatars, but this is what you get from a real data-driven market segmentation analysis.
Make The Right Decisions With By Quantifying Your Market Segments
When it’s complete, the analysis looks like this:
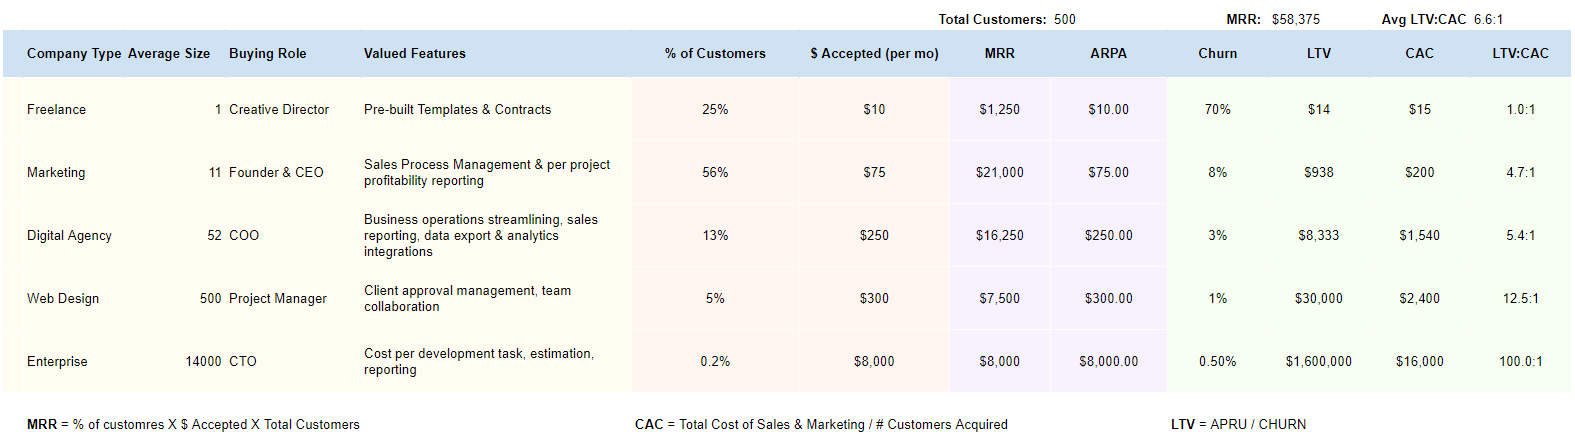
This table includes the following fields:
- Market Segment
- Segment Identifying Data (below are examples, and change from industry to industry):
- Company Size
- Head Count
- Revenue
- Company Type
- etc.
- Buying role(s)
- Valued features & order of priority
- Percentage of customers
- The amount they are willing to spend for your product
- Monthly recurring revenue (MRR) from each segment
- Average revenue per account (ARPU)
- Churn rates
- Lifetime value (LTV)
- Cost of acquisition (CAC)
Let’s break this document down into its parts:
Segment Identifying Information:

This area covers the most important segment identifying information. In this case, it’s the headcount and the title of the segment. But it could be so many things. For example, in some groups I have worked on it has been things like:
- Company type (for a recent client, it was agency vs. brick-and-mortar businesses)
- Corporate revenue
- Number of potential accounts
- Monthly usage potential
- Investment dollars
- Miles driven per month
- etc., etc., etc.
It’s important to have data points here that clearly identify the segment in a meaningful way for your industry and business. The only way to really understand how to get this data is through a thorough understanding of your market. In the case above, the primary difference between our different groups was just headcount. But very often it is revenue or business type.
Buying Roles

In this area, we look at who is the primary decision maker for each segment. This is important because we need to understand who we are speaking to and why they make their decisions. This area is the data point that most closely maps to customer avatar information. It is important here because different buying roles value features in different priorities.
For example, if a CEO is making a buying decision, they will likely find analytics to be very important. Whereas if a Marketing Manager is the buyer, features related to efficiency may be the most important. Because these people have different job roles, inevitably their buying decisions will reflect that. So we need to be clear on the buyers so that when we look at the next set of data points below, they align to the buyer’s needs.
With most B2B enterprise SaaS & software, there are multiple buyer types at play. In this area, we enter the primary decision maker, but you could also add an additional column or columns for additional decision makers if it is relevant.
Valued Features:

The valued features column is one of the most important and difficult-to-determine data sets. Sometimes these fields are very similar across all the buyer types. But almost all the time, the priority of features is different for different buyers and different segments. Understanding how and why is critical to delivering the right messaging to each segment.
One way to determine the order of importance for features and what features are and are not important for different segments is to ask the following questions:
- Why did they choose us?
- Why didn’t they just do this by themselves?
- When we talked to the customer, which features did they gravitate towards the most?
- What features could they not do without?
Once you understand these questions, then you can really answer the question ‘what is the order of priority of the features we offer within our application’?
Customer Count, MRR, & Amount They Will Pay

MRR = % of customers X Total Customers X $ Accepted
Now, we’re starting to get into the ‘meat’ of the data. This area covers seemingly clear data on what percentage of your customers are in each segment, how much money they are willing to spend per user or per usage, and what the MRR is for each segment.
The reason that I say it’s ‘seemingly clear’ is because it looks easy once you have everything compiled, but figuring out how to group these segments is the real challenge. More often than not, it’s not clear at all where different kinds of customers go and how to build the segments.
You have questions like:
- This customer has the same headcount as that customer, but they value completely different feature sets, so where do I put them?
- The customer headcounts and features are very similar, but the buying roles are completely different, are my buying roles really set up properly?
- This customer would never pay as much as that customer, but their buying roles are very similar (or too complex to take into account) and their priority order of features is very similar, which group do we put them into? Or maybe we have to rethink all of our groups?!
The list goes on, and it takes a lot of time to answer these questions, but once it’s done, it’s well worth it.
Average Revenue Per Unit (ARPU) or Average Revenue Per Account (ARPA)

The ARPU or ARPA is the average amount of money paid per account in this case. For this item, just add up the amount paid for recurring revenue for all the customers in the segment and divide it by the total number of customers in the segment.
Churn rate is defined however you’re calculating churn; this could be monthly, quarterly, or yearly. What’s important is that all the segments use the same churn rate in this document.
Lifetime Value (LTV), Cost of Acquisition (CAC), & the LTV to CAC Ratio

The LTV is the easy part since it’s just a calculation on data most companies have easily available. But the CAC has some subtleties.
Here are the formulas:
- LTV = ARPU/Churn
- CAC = Total Cost of Marketing & Sales / Number of Acquired Customers
The CAC is calculated over a period of time. For businesses that have some history and whose pricing is low to mid, generally, this is on a monthly basis. Whereas for companies that have higher costs and longer sales cycles, the CAC (and corresponding Churn) may be calculated quarterly or annually. As long as you are calculating churn and CAC within the same period, it’s fine.
The other problem is that many companies that were not tracking the data granularly do not know how CAC is different for different segments. These companies often have just sales and marketing budgets but are not differentiating in a meaningful way how the money is being spent between different segments. If this is the case and there is no way to separate it, then just allot the same CAC to all segments.
But if you know that larger sales require more meetings, then perhaps weigh these a bit higher budget-wise and the others a bit less. The more data you collect on how sales are done, what takes more time, where money is spent, etc., the more clearly you can understand which customers are truly your most valuable.
Analyzing The Market Segmentation In B2B SaaS
The Freelancer Market Was Losing Money
In the attached example, after we ran the numbers we found that for the Freelance segment, we were spending $15 for every $14 we were making! We hadn’t really noticed it previously because this group was by far the most engaged and had the most questions. Also because it represented 25% of our customers it never dawned on us that we could possibly be losing money on them.
The issue here was that this group had a huge churn rate, but it was the nature of the group. They entered and exited the market frequently. So after a lot of thought, we decided to abandon focusing on this group and instead focused up-market.
Comparing Segments & Future Work
For the Marketing segment, we still had a very high churn rate of 8%. At the same time, our larger size customers in the Digital Agency group were paying a lot more per unit at $250 vs $75 for the Marketing segment.
We felt like we could increase the ARPU for the Digital Agency group if we focused on new features that they were requesting, or we could focus on improving a feature set that the Marketing segment was complaining about that was driving most of the growth.
We assumed that we could bring the churn rate for the Marketing group down from 8% to 5% with the feature changes or we could increase the Digital Agency ARPU from $250 to $285. Now we can see the impact of each of these scenarios against one another in revenue, LTV, and LTV:CAC.
Let’s take a look:

Our most valuable customer from the perspective of CAC to LTV ratio with the decreased churn rate vs the increased ARPU is the Marketing Segment. This quick review helps us quickly identify what our next steps would be in feature development.
Data-Driven Messaging
Obviously, there are a variety of additional ways to analyze this data and compare changes side by side. But also, and oftentimes more importantly, this gives us a system to understand how to talk to customers.
Since we took the time to understand what features are more important to different buying roles, we know how to:
- Put together our pricing page on the website
- Write copy for different buying roles on the website
- Present in sales meetings
All based on what’s important to the person or people we are speaking with. Perhaps the most important item here is that your marketing budget now has a greater chance of being maximally utilized.
Compiling Data
This is where things get hairy for a lot of reasons:
- Those easy-to-consume segment names most often don’t exist before you actually compile the data.
- You don’t know who the buyers are because sales and marketing departments don’t communicate effectively.
- No one ever asked customers why they bought from you instead of competitors
- There is no data on who your customers actually are, how much revenue they produce, or what their headcount, among many other things.
- Your team doesn’t have data on what industry or niche each customer is in.
- Cost of acquisition spend isn’t easy to separate between different customer segments.
In other words, the biggest issue I see is that businesses aren’t compiling their data, asking the right questions to their customers on a regular basis, and sales and marketing aren’t talking enough. If this is you, don’t worry, it’s most companies.
What you’ll need to do is put together a spreadsheet with all the relevant data data. It can be big, real big.
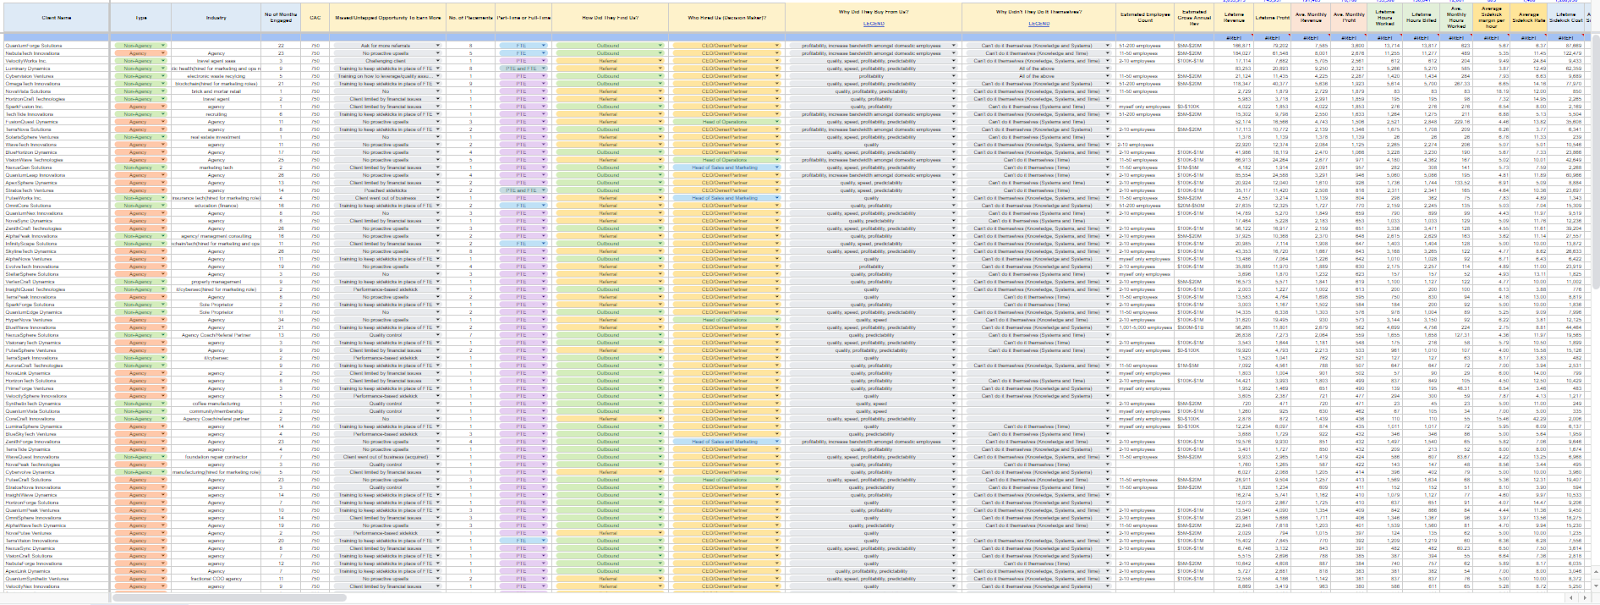
This is only a 10th of all the columns in this spreadsheet
If you want great answers to important questions, it’s going to take time and probably cost some money. But that’s what it takes.
The data compilation process is generally broken into these steps:
- Gather source data: Identify who your customers are and collect key information, such as their business type, revenue, size buying habits, decision makers, lifetime value, churn, etc.
- Identify valued features: The valued features prioritization portion is usually the most challenging portion. Ask your customers to rank the most important features they need, why they chose you over the competitors, and why they didn’t do things themselves. Overlaps often exist, but knowing each segment’s priorities will help you tailor your approach.
- Determine customer motivation: Find out why customers choose your product. Are they looking for ease of use, compliance, or cost savings? Knowing their motivation aligns your product development with their needs.
- Segment customers: Use the data to categorize customers by factors like employee count, annual revenue, and product engagement. This helps you personalize your marketing strategy for each segment.
- Analyze data: Create charts and tables showing each segment’s LTV, CAC, and churn rates. These metrics allow you to prioritize profitable customers and make strategic adjustments.
Not only will you need to compile all this data, but after you have it, you’ll need to group the data accordingly and then run your groupings by executives and team leads to ensure it’s all done properly and everyone agrees with how it’s all set up.
One the positive side, every time I have run this kind of analysis with a team, they have clear discoveries throughout the process that greatly impacts their messaging, sales processes, and marketing systems.
Key Insight: SaaS products typically save time and streamline operations, but why do some customers still opt for DIY solutions? Understanding this can unlock valuable insights into your customers’ behavior and help you make game-changing adjustments.
Ultimately, mastering customer segmentation enables precise resource allocation, data-driven decisions, and sustainable growth for your B2B SaaS business.
Maximizing Growth and Profitability in B2B SaaS
Effective sales and marketing stem from the insights derived from data. When you understand:
- Who are your most valuable customers
- Who makes the buying decisions
- What features most drive buying decisions
- The impact of changes to revenue, CAC, and churn to the MRR or ARR for each customer segment
Then you can confidently make investment decisions, and even if acquisition costs seem high, you’ll know they will deliver returns. A detailed segmentation analysis is the foundation for effective marketing in B2B SaaS. It ensures your resources are invested properly to yield the highest returns, growth, and profitability. The continuous need to refine your segmentation analysis will help you stay ahead of the competition and maintain your growth trajectory.
And if all of this seems a bit much to handle, JHMG can help; we can not only collect but also analyze this valuable customer data, not to mention that we can help you on every step of your B2B SaaS journey.
If you have any questions or want to get in touch, reach us here.


